77 Supervised Learning: Introduction
77.1 Theoretical concepts
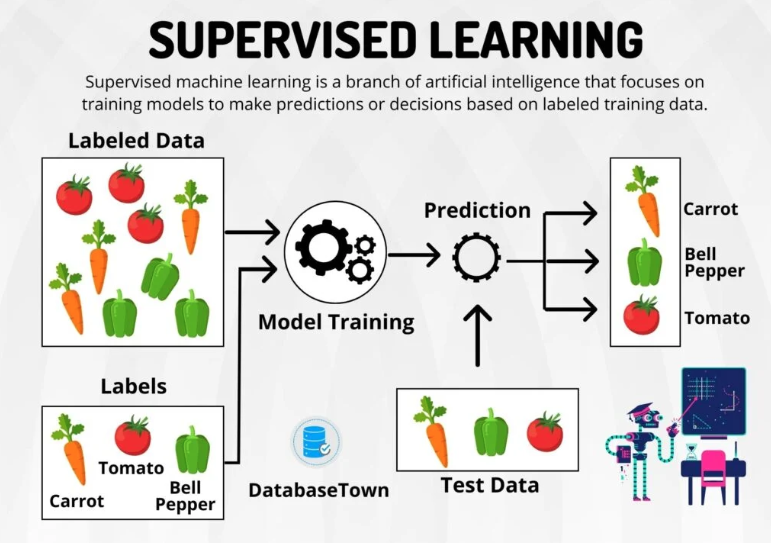
Supervised learning is a type of machine learning where the algorithm is trained on a labeled dataset.
‘Labeled’ means that each example in the training dataset is paired with the correct output. The algorithm then learns to predict the output from the input data. Once the model is trained, it can be used to make predictions on new, unseen data.
Key ideas and processes in supervised learning
“Training Set”
The training set is the dataset used to train the machine learning model. It consists of input-output pairs where the outputs are known. The training set is the heart of supervised learning, providing the data that algorithms use to learn and make predictions.
This set is a collection of examples (data), usually gathered from real-world observations, and includes both input features and the corresponding target outputs.
![]()
Empirical Risk Minimisation (ERM) Theory
Empirical Risk Minimisation is central to supervised learning. The idea here is to find a function (from a set of possible functions) that minimises the loss on the training data.
This loss quantifies the discrepancies between the predicted and actual outputs. ERM is critical in understanding how models are trained to fit the data as closely as possible while also aiming to generalise well to unseen data.
Bias-Variance Tradeoff
- This helps in understanding the behavior of the training set in model generalisation. The bias refers to errors due to overly simplistic assumptions in the learning algorithm.
- In contrast, variance refers to errors due to the model’s excessive sensitivity to small fluctuations in the training set.
- An ideal model achieves a balance where both bias and variance are minimized, leading to improved generalisation and performance on new, unseen data.
Overfitting and Underfitting
- Overfitting occurs when a model learns the detail and noise in the training data to the extent that it negatively impacts the model’s performance on new data. This means the model is too complex, capturing patterns in the training data that do not generalise to unseen data.
- Underfitting, on the other hand, occurs when a model is too simple to learn the underlying structure of the data.
“The Model”
In supervised learning, a ‘model’ is a mathematical representation of the real-world process that generates the data. It’s built by learning the relationships between the inputs and outputs of the training set.
![]()
Optimisation Algorithms
The process of learning in supervised learning often boils down to an optimisation problem where the algorithm seeks to minimise a loss function (see above). It can do this using various optimisation algorithms, including:
Gradient Descent: a fundamental optimisation algorithm used in training many supervised learning models, especially neural networks. It iteratively adjusts the parameters of the model in the direction that decreases the loss function.
Regularisation: a technique used to prevent overfitting (see above) by penalising large coefficients in the model.
Probabilistic Models and Bayesian Thinking
Many supervised learning models are framed in probabilistic terms, as a way to deal with uncertainty and variability in the data.
Bayesian Learning incorporates prior knowledge about the parameters and updates this knowledge as evidence accumulates. For example, Bayesian linear regression provides a probabilistic view of the linear regression model, estimating a distribution over possible model parameters rather than finding a single best estimate. See here for more on Bayesian probability.
Maximum Likelihood Estimation (MLE) is a method of estimating the parameters of a statistical model. In the context of supervised learning, MLE is used to find the parameter values that maximise the likelihood of the observed data.
Maximum a Posteriori (MAP) Estimation: Unlike MLE, which only considers the likelihood of the observed data, MAP estimation also incorporates prior knowledge about the distribution of the parameters, resulting in more robust parameter estimates.
“Model Features”
These are the input variables used in making predictions. The model learns how these features relate to the output during the training process.
![]()
Feature Representation
Feature Space: This is the multi-dimensional space where each dimension represents a feature used to describe the instances. The choice of features and how they are encoded can significantly affect the model’s ability to learn effectively.
Encoding and Scaling: Features need to be appropriately encoded and scaled for use in machine learning models. For example, categorical variables are often converted into numerical values through one-hot encoding. Continuous features might be normalized or standardised to ensure that they contribute equally to the model training.
Feature Engineering
Feature Extraction: This is the process of transforming raw data into a set of features that are meaningful for a specific problem. For example, extracting color histograms from images or sentiment scores from text can be considered forms of feature extraction.
Feature Construction: This involves creating new features from the existing ones, often by applying mathematical transformations or by combining multiple features.
Dimensionality Reduction: Techniques like Principal Component Analysis (PCA) or Linear Discriminant Analysis (LDA) are used to reduce the number of features, focusing on the most informative ones and reducing computational complexity.
Feature Selection
Filter Methods: These methods select features based on their statistical properties and are independent of any machine learning algorithm. For example, features can be selected based on correlation with the target variable.
Wrapper Methods: These involve using a predictive model to evaluate the effectiveness of different subsets of features, selecting the subset that results in the best model performance.
Embedded Methods: These methods perform feature selection as part of the model training process. For example, Lasso regression can shrink the coefficients of less important features to zero, effectively performing feature selection.
“Target Variable”
This is the output variable that the model is trying to predict. In supervised learning, each observation in the training set has a corresponding target variable.
Significance of target variables
Learning Signal: The target variable provides the essential signal that guides the supervised learning algorithm. By comparing the predicted outputs with the actual target values, the model can adjust its parameters to improve its predictions during the training process.
Evaluation: The accuracy of a model in supervised learning is determined based on how well the predicted values match the target variable values. Different metrics are used for this evaluation, depending on whether the task is regression or classification.
Types of Target Variables
Continuous Target Variables: In regression tasks, the target variable is continuous, meaning it can take any value within a range. Examples include predicting house prices, stock prices, or temperatures.
Categorical Target Variables: In classification tasks, the target is categorical, meaning it takes on values from a limited set of categories. This can be binary (e.g., yes/no, spam/not spam) or multi-class (e.g., types of fruits, categories of news articles).
Role of the target variable in different learning tasks
See below for more on the difference between regression and classification tasks.
Regression: Here, the model predicts a continuous quantity. The target variable in regression is used to measure the error of the predictions (e.g., through mean squared error) and guide the model to reduce this error over time.
Classification: In classification tasks, the target variable indicates the class membership of each observation. The model’s goal is to predict this membership accurately. Performance is often measured by metrics like accuracy, precision, recall, and the F1 score.
Implications on model choice
Choice of Model: The nature of the target variable often dictates the choice of the machine learning model or algorithm. For example, linear regression is suited for continuous targets, while logistic regression is used for binary classification tasks.
Loss Function Selection: The choice of loss function, which the model aims to minimize, is directly influenced by the target variable. For instance, mean squared error is common for regression, while cross-entropy loss is used for classification.
77.2 Regression and classification tasks: what’s the difference?
In supervised learning, there are primarily two types of tasks: regression and classification. Both involve learning from labeled data, but they differ fundamentally in what they are predicting.
![]()
Regression Tasks
In regression, the output variable is continuous. This means the model predicts a quantity that can take any value within a range. The goal of regression is to predict a value as close as possible to the actual numerical value.
Example: Predicting the price of a house based on features like size, location, and number of bedrooms.
Metrics: The performance of a regression model is typically evaluated using metrics like Mean Squared Error (MSE) or Mean Absolute Error (MAE).
Classification Tasks
In contrast, classification deals with discrete output values. The model predicts which category or class the new observation belongs to.
Example: An email classification system that labels incoming emails as ‘spam’ or ‘not spam’.
Binary Classification: This involves two classes. For instance, determining whether a tumor is malignant (positive class) or benign (negative class).
Multiclass Classification: Here, there are more than two classes. For example, a model that categorises news articles into ‘sport’, ‘politics’, ‘technology’, etc.
Metrics: Classification models are evaluated using different metrics, such as accuracy, precision, recall, and F1 score.
Key Differences
Regression predicts continuous values, while classification predicts discrete labels.
Different metrics are used to evaluate performance. Regression commonly uses MSE or MAE, while classification uses accuracy, precision, recall, etc.
In classification, the algorithm learns a boundary that divides different classes. In contrast, regression involves finding a line (or curve in multiple dimensions) that best fits the data points.
77.3 The supervised learning process
.png)